
What is Inventory Turnover Rate?
What is Inventory Turnover Rate?
What is Inventory Turnover Rate?
Inventory turnover rate shows how many times inventory is consumed and renewed in a period. It is found by dividing the cost of goods sold by the average inventory. The normal range varies by industry; a high value indicates fast circulation, while a low value indicates tied-up capital. Shelf layout and ordering policy directly affect the ratio.
What is stock turnover rate, how is its formula set up, and how is stock turnover calculated? Sectoral ranges, interpretation methods, and rack system selection are in this guide.
Inventory turnover rate shows how many times inventory is consumed and renewed in a period. It is found by dividing the cost of goods sold by the average inventory. The normal range varies by industry; a high value indicates fast circulation, while a low value indicates tied-up capital. Shelf layout and ordering policy directly affect the ratio.

Inventory turnover is the ratio that shows how many times a business consumes and replenishes its stock on hand during a given period. The measurement is usually done annually and the result is expressed as a simple number.
If the value is six, it means the stock was depleted and replaced with new stock six times during the year. A high number indicates fast circulation, while a low number points to materials remaining on standby.
The importance of the ratio comes from tied-up capital. Each pallet waiting on the shelf takes up both money and space.
The measurement is not only a financial indicator. It serves as the starting point for many decisions, from warehouse layout to ordering policy.
What is the Inventory Turnover Formula?
The inventory turnover formula is established by dividing the cost of goods sold by the average inventory value.
Inventory Turnover = Cost of Goods Sold / Average Inventory Value
The denominator uses the cost of goods sold, not revenue. Since revenue also includes profit margin, it artificially inflates the ratio.
Average inventory is the arithmetic mean of the beginning and ending values of the period. In businesses with high volatility, monthly averages are preferred.
There is also a quantity-based version of the formula. The number of units sold is divided by the average number of inventory units, yielding a result independent of monetary value.
This second version is more reliable during periods of high inflation. It is suitable for comparison because price changes do not distort the result.
How to Calculate Inventory Turnover?
The calculation begins with defining the period and is completed in four steps. The same period is used for both the numerator and the denominator.
Period is Selected: An annual, quarterly, or monthly range is determined. Comparisons are made between periods of the same length.
Cost Data is Collected: The total cost of products sold during the period is obtained from accounting records.
Average Inventory is Found: The beginning and ending inventory values of the period are added and divided by two.
Division is Performed: The total cost is divided by the average inventory and the result is read.
A numerical example clarifies the subject. The annual cost of goods sold is taken as 12 million, the beginning inventory as 1.8 million, and the ending inventory as 2.2 million.
In this case, the average inventory is 2 million. The ratio is found to be 6 by dividing 12 by 2.
To convert the result into days, the number 365 is divided by the ratio. A turnover rate of six corresponds to a holding period of approximately 61 days.
How is Inventory Turnover Interpreted by Industry?
The same number does not mean the same thing in every industry. For a correct interpretation, the value must be compared with the industry average.
Industry | Typical annual range | Determining factor |
|---|---|---|
Fresh food and grocery | 15 - 40 | Short shelf life |
Fast-moving consumer goods | 8 - 15 | High demand frequency |
Automotive spare parts | 3 - 6 | Wide product variety |
Ready-to-wear clothing | 3 - 5 | Season dependency |
Heavy machinery and industry | 2 - 4 | Long lead time |
Jewelry and luxury products | 1 - 2 | High unit value |
The second leg of the comparison is the business's own history. A value that remains below the industry average is interpreted positively if it is rising in its own trend.

What Do High and Low Inventory Turnover Mean?
A high ratio indicates that the material is selling quickly and capital is not tied up in stock for a long time. Warehousing costs decrease, and the risk of spoilage and obsolescence is reduced.
However, there is also a limit to a high value. An excessively high ratio may indicate that safety stock is insufficient and stockouts occur frequently.
On the other hand, a low ratio means that the stock is waiting on the shelf. Capital is tied up, warehouse space fills up, and over time, dead stock is created.
The reason for a low value is not always weak sales. Bulk purchase discounts, long lead times, or pre-season preparation also temporarily pull the ratio down.
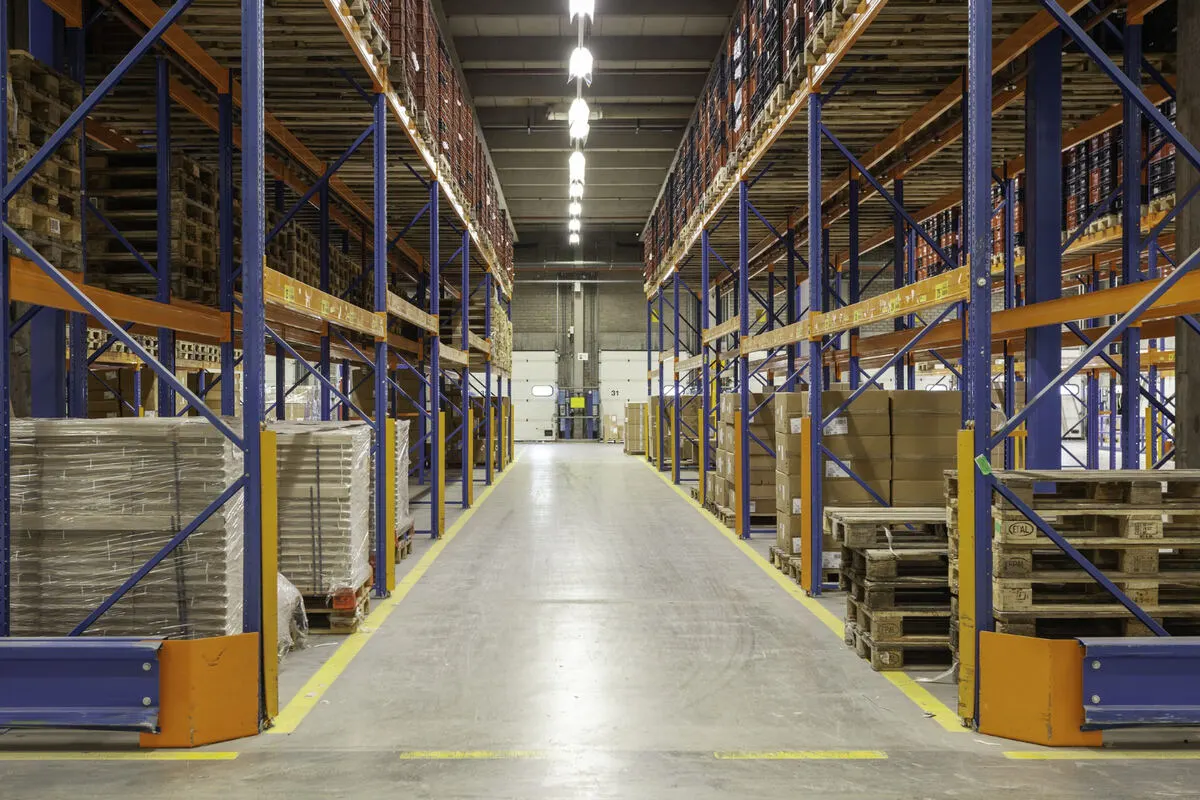
In high-turnover products, the shelf layout is expected to adapt to the flow. A pallet flow rack layout, loaded from one end and picked from the other, ensures that the emptying slot is automatically filled by the pallet behind it.
How to Choose a Warehouse Racking System That Increases Inventory Turnover?
The racking system is chosen by looking at the circulation speed of the product and the number of varieties. A wrong match leads to a low ratio even if sales increase.
Five criteria stand out in the selection.
Turnover Class: Fast, medium, and slow-moving items are segregated. Each class is placed in a different zone.
Pallet Accessibility: The question of whether direct access to each pallet or density is the priority is answered.
Flow Direction: It is determined whether loading and picking faces will be separated.
Lane Depth: It is calculated how many pallets of the same product can stand behind each other.
Picking Distance: The path traveled by the operator per order is measured.
When both density and speed are sought in deep lanes, semi-automatic solutions come into play. The pallet shuttle racking system, where an electric carrier moves the pallet within the lane, shortens the entry and exit time because the forklift does not enter the aisle.
In warehouses with a high number of varieties, accessibility priority outweighs other factors. Pallet racking systems, where each pallet is reached with a single movement, allow fast and slow items to be distributed to separate zones.
What Can Be Done to Improve Inventory Turnover?
Improvement is achieved not through a single intervention, but through sequential work. A five-step routine yields results in most businesses.
Measurement Base is Established: The ratio is calculated first in total, and then based on product groups. This reveals where the problem lies.
Products are Classified: Items are grouped according to their contribution to revenue. The low-contribution and slow-moving group is handled separately.
Order Quantity is Redetermined: The bulk purchase advantage is compared with the holding cost. The batch size is reduced accordingly.
Slow Items are Liquidated: Products that have not moved for a long time are cleared out through discounts, bundle sales, or returns.
Layout Design is Updated: Fast items are moved to the zone close to the shipping dock. Picking time is shortened.
The accuracy of demand forecasting feeds all of these steps. If the forecast is inaccurate, excess stock will accumulate again, no matter how well the rack layout is established.
The ratio itself is not a target, but an indicator. When stock is cut back to artificially raise the number, sales losses occur. A healthy result is achieved when the procurement plan and the warehouse layout look at the same data.
Inventory turnover is the ratio that shows how many times a business consumes and replenishes its stock on hand during a given period. The measurement is usually done annually and the result is expressed as a simple number.
If the value is six, it means the stock was depleted and replaced with new stock six times during the year. A high number indicates fast circulation, while a low number points to materials remaining on standby.
The importance of the ratio comes from tied-up capital. Each pallet waiting on the shelf takes up both money and space.
The measurement is not only a financial indicator. It serves as the starting point for many decisions, from warehouse layout to ordering policy.
What is the Inventory Turnover Formula?
The inventory turnover formula is established by dividing the cost of goods sold by the average inventory value.
Inventory Turnover = Cost of Goods Sold / Average Inventory Value
The denominator uses the cost of goods sold, not revenue. Since revenue also includes profit margin, it artificially inflates the ratio.
Average inventory is the arithmetic mean of the beginning and ending values of the period. In businesses with high volatility, monthly averages are preferred.
There is also a quantity-based version of the formula. The number of units sold is divided by the average number of inventory units, yielding a result independent of monetary value.
This second version is more reliable during periods of high inflation. It is suitable for comparison because price changes do not distort the result.
How to Calculate Inventory Turnover?
The calculation begins with defining the period and is completed in four steps. The same period is used for both the numerator and the denominator.
Period is Selected: An annual, quarterly, or monthly range is determined. Comparisons are made between periods of the same length.
Cost Data is Collected: The total cost of products sold during the period is obtained from accounting records.
Average Inventory is Found: The beginning and ending inventory values of the period are added and divided by two.
Division is Performed: The total cost is divided by the average inventory and the result is read.
A numerical example clarifies the subject. The annual cost of goods sold is taken as 12 million, the beginning inventory as 1.8 million, and the ending inventory as 2.2 million.
In this case, the average inventory is 2 million. The ratio is found to be 6 by dividing 12 by 2.
To convert the result into days, the number 365 is divided by the ratio. A turnover rate of six corresponds to a holding period of approximately 61 days.
How is Inventory Turnover Interpreted by Industry?
The same number does not mean the same thing in every industry. For a correct interpretation, the value must be compared with the industry average.
Industry | Typical annual range | Determining factor |
|---|---|---|
Fresh food and grocery | 15 - 40 | Short shelf life |
Fast-moving consumer goods | 8 - 15 | High demand frequency |
Automotive spare parts | 3 - 6 | Wide product variety |
Ready-to-wear clothing | 3 - 5 | Season dependency |
Heavy machinery and industry | 2 - 4 | Long lead time |
Jewelry and luxury products | 1 - 2 | High unit value |
The second leg of the comparison is the business's own history. A value that remains below the industry average is interpreted positively if it is rising in its own trend.
What Do High and Low Inventory Turnover Mean?
A high ratio indicates that the material is selling quickly and capital is not tied up in stock for a long time. Warehousing costs decrease, and the risk of spoilage and obsolescence is reduced.
However, there is also a limit to a high value. An excessively high ratio may indicate that safety stock is insufficient and stockouts occur frequently.
On the other hand, a low ratio means that the stock is waiting on the shelf. Capital is tied up, warehouse space fills up, and over time, dead stock is created.
The reason for a low value is not always weak sales. Bulk purchase discounts, long lead times, or pre-season preparation also temporarily pull the ratio down.
In high-turnover products, the shelf layout is expected to adapt to the flow. A pallet flow rack layout, loaded from one end and picked from the other, ensures that the emptying slot is automatically filled by the pallet behind it.
How to Choose a Warehouse Racking System That Increases Inventory Turnover?
The racking system is chosen by looking at the circulation speed of the product and the number of varieties. A wrong match leads to a low ratio even if sales increase.
Five criteria stand out in the selection.
Turnover Class: Fast, medium, and slow-moving items are segregated. Each class is placed in a different zone.
Pallet Accessibility: The question of whether direct access to each pallet or density is the priority is answered.
Flow Direction: It is determined whether loading and picking faces will be separated.
Lane Depth: It is calculated how many pallets of the same product can stand behind each other.
Picking Distance: The path traveled by the operator per order is measured.
When both density and speed are sought in deep lanes, semi-automatic solutions come into play. The pallet shuttle racking system, where an electric carrier moves the pallet within the lane, shortens the entry and exit time because the forklift does not enter the aisle.
In warehouses with a high number of varieties, accessibility priority outweighs other factors. Pallet racking systems, where each pallet is reached with a single movement, allow fast and slow items to be distributed to separate zones.
What Can Be Done to Improve Inventory Turnover?
Improvement is achieved not through a single intervention, but through sequential work. A five-step routine yields results in most businesses.
Measurement Base is Established: The ratio is calculated first in total, and then based on product groups. This reveals where the problem lies.
Products are Classified: Items are grouped according to their contribution to revenue. The low-contribution and slow-moving group is handled separately.
Order Quantity is Redetermined: The bulk purchase advantage is compared with the holding cost. The batch size is reduced accordingly.
Slow Items are Liquidated: Products that have not moved for a long time are cleared out through discounts, bundle sales, or returns.
Layout Design is Updated: Fast items are moved to the zone close to the shipping dock. Picking time is shortened.
The accuracy of demand forecasting feeds all of these steps. If the forecast is inaccurate, excess stock will accumulate again, no matter how well the rack layout is established.
The ratio itself is not a target, but an indicator. When stock is cut back to artificially raise the number, sales losses occur. A healthy result is achieved when the procurement plan and the warehouse layout look at the same data.
Frequently Asked Questions (FAQ) About Inventory Turnover Rate
Frequently Asked Questions (FAQ) About Inventory Turnover Rate
Frequently Asked Questions (FAQ) About Inventory Turnover Rate
How many times a year should the inventory turnover rate be?
There is no single target applicable to all sectors. As a general reference, a value of between four and six per year is considered reasonable in many manufacturing and distribution businesses. In retail, expectations are much higher, while in heavy industry, low values are normal. The meaningful benchmark is the sector average and the business's own historical data.
What is the difference between stock turnover period and stock turnover rate?
How is average inventory found in the calculation of inventory turnover rate?
How often is inventory turnover measured?
Can stock turnover rate be calculated on a product basis?



Contact
Do you want to receive more information? We have expert and reliable contact persons available for any questions, issues, and suggestions.
Reta Engineering Warehouse Racking Systems Industry and Trade Inc.
Address
Muradiye Organized Industrial Zone, 10th St. No: 30 Yunusemre / Manisa
info@retamuhendislik.com.tr